How was the eruption of this volcano measured from space
The eruption of Fagradalsfjall volcano in Iceland can be observed from space. Scientists Virginie Pinel, Etienne Bertier and Joaquin MC Bellart explain in the conversation how the progress of the lava flow can be tracked in real time.
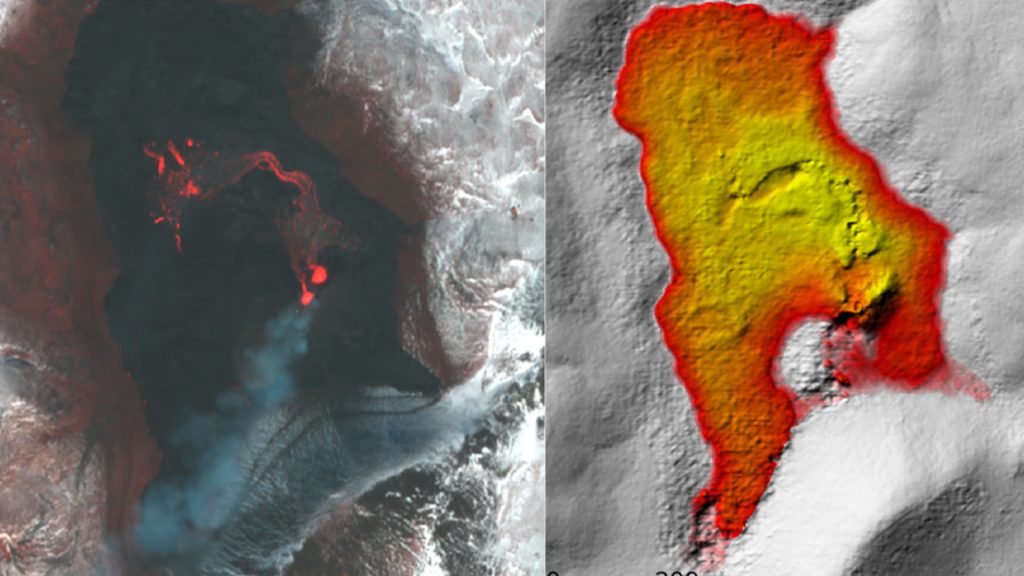
Almost the entire population of Iceland lives under the threat of volcanoes. Friday, March 19, 2021 at approximately 8:45 pm, a volcanic eruption began in an area that has not had an eruption since the 14th.e Century, less than 40 km from the capital Reykjavik. It is a streamflow eruption of a small size: liquid magma is emitted at the surface in the form of streams in an uninhabited area. The images from the “Pleiades” moons made it possible to instantly map the progress of the lava flow and estimate the rate of magma emitted at about 6 cubic meters per second during the first ten days of the eruption.
Pléiades is a pair of satellites designed by him CNES Its products are distributed by Airbus Defense and Space. These satellites allow to obtain two high-resolution optical images (the size of the pixel of the Earth on the order of 70 cm) of the same area of the Earth’s surface. If we take a few dozen seconds apart with a slightly different viewing angle, these are “stereoscopic” images. It can be combined to get a three-dimensional vision, as our brain does from images recorded by our eyes.
If the surface of the Earth is visible, that is, since it is not obscured by the presence of clouds, it is possible to create a topographic map by means of “stereoscopy,” a map we call “digital surface model”, with better accuracy than an abacus.

It follows the progress of a lava flow directly
Basalt flux is usually a few tens of meters thick. So its thickness can be measured by making a difference between the card obtained before it was installed and that which was produced afterward. The use of optical images also makes it possible to accurately map the surface of the area covered by the casting. By multiplying the thickness of the lava by its extent, it is possible to estimate the volume of magma spreading over the surface.
In the case of the Icelandic eruption, many images were obtained during the eruption. This is exceptional and has made it possible to construct serial digital surface models. We were able to follow or approximate the progress of the lava flow, and we were able to estimate the increase in the volume of this flow. This corresponds to the rate of magma emitted, and is essential data for understanding volcanic eruption dynamics. When the first image was obtained on March 22, 3 days after the eruption, 1.3 million cubic meters of magma had already been released and this volume rose after 8 days to nearly 5 million cubic meters.
The beginning of the eruption
The onset of the eruption of the Vagrad-Sval volcano was actually predictable, thanks to the precursor signals recorded in the previous weeks: a significant increase in earthquakes and ground deformation measured by satellite radar interferometry. From the day following the start of the eruption, daily acquisitions by Pleiades satellites were scheduled for ten days, at the request of CNES. This rapid response is also made possible because the French scientific community is taking advantage ofCIEST2 Initiative The Form @ Ter Pole, Which aims to enhance access to satellite data in the event of a natural disaster.
Of the ten pairs of Pleiades images obtained, five provided a clear view of the eruption site and were able to provide usable information. The images were available approximately two hours after acquisition, and were promptly downloaded and promptly processed to provide an estimate of lava production three hours later. Data were processed in parallel in French laboratories ISTerre And the Legos And others’University of Iceland). This allowed the results to be quickly disseminated to the teams responsible for managing the volcanic crisis on the ground.
Satellite data provided, for the first time in real time, information on the size of magma emitted during the eruption. This demonstrates the interest of this remote sensing data in the operational response to a volcanic crisis. The rash is still persistent for now, more than a month later. Observation is now done by airborne measurements and images of the Pleiades will be acquired less frequently to complete the observations. On site.
Virginie PinelVolcanology researcher Research Institute for Development (IRD) ; Etienne BertierGlaciologist at the Geophysics and Oceanography Space Laboratory, Midi-Pyrenees Observatory And the Joaquin MC BellartCoordinator for Remote Sensing at the National Land Survey of Iceland. Postdoctoral researcher in glaciology. University of Iceland
This article was republished from Conversation Under a Creative Commons license. Read theThe original article.
Share on social media
Continuation in the video

“Organizer. Social media geek. General communicator. Bacon scholar. Proud pop culture trailblazer.”

